
ENPT
React · Data Visualization
Year
Role
Duration
Team
Tools
View Project
Trading interfaces pack dense real-time data; the challenge was making them readable without losing depth.
Product Designer & Front-end, solo, from design to Next.js implementation.
A working platform with live order book, candlestick, depth chart, watchlist, alerts and interactive onboarding.
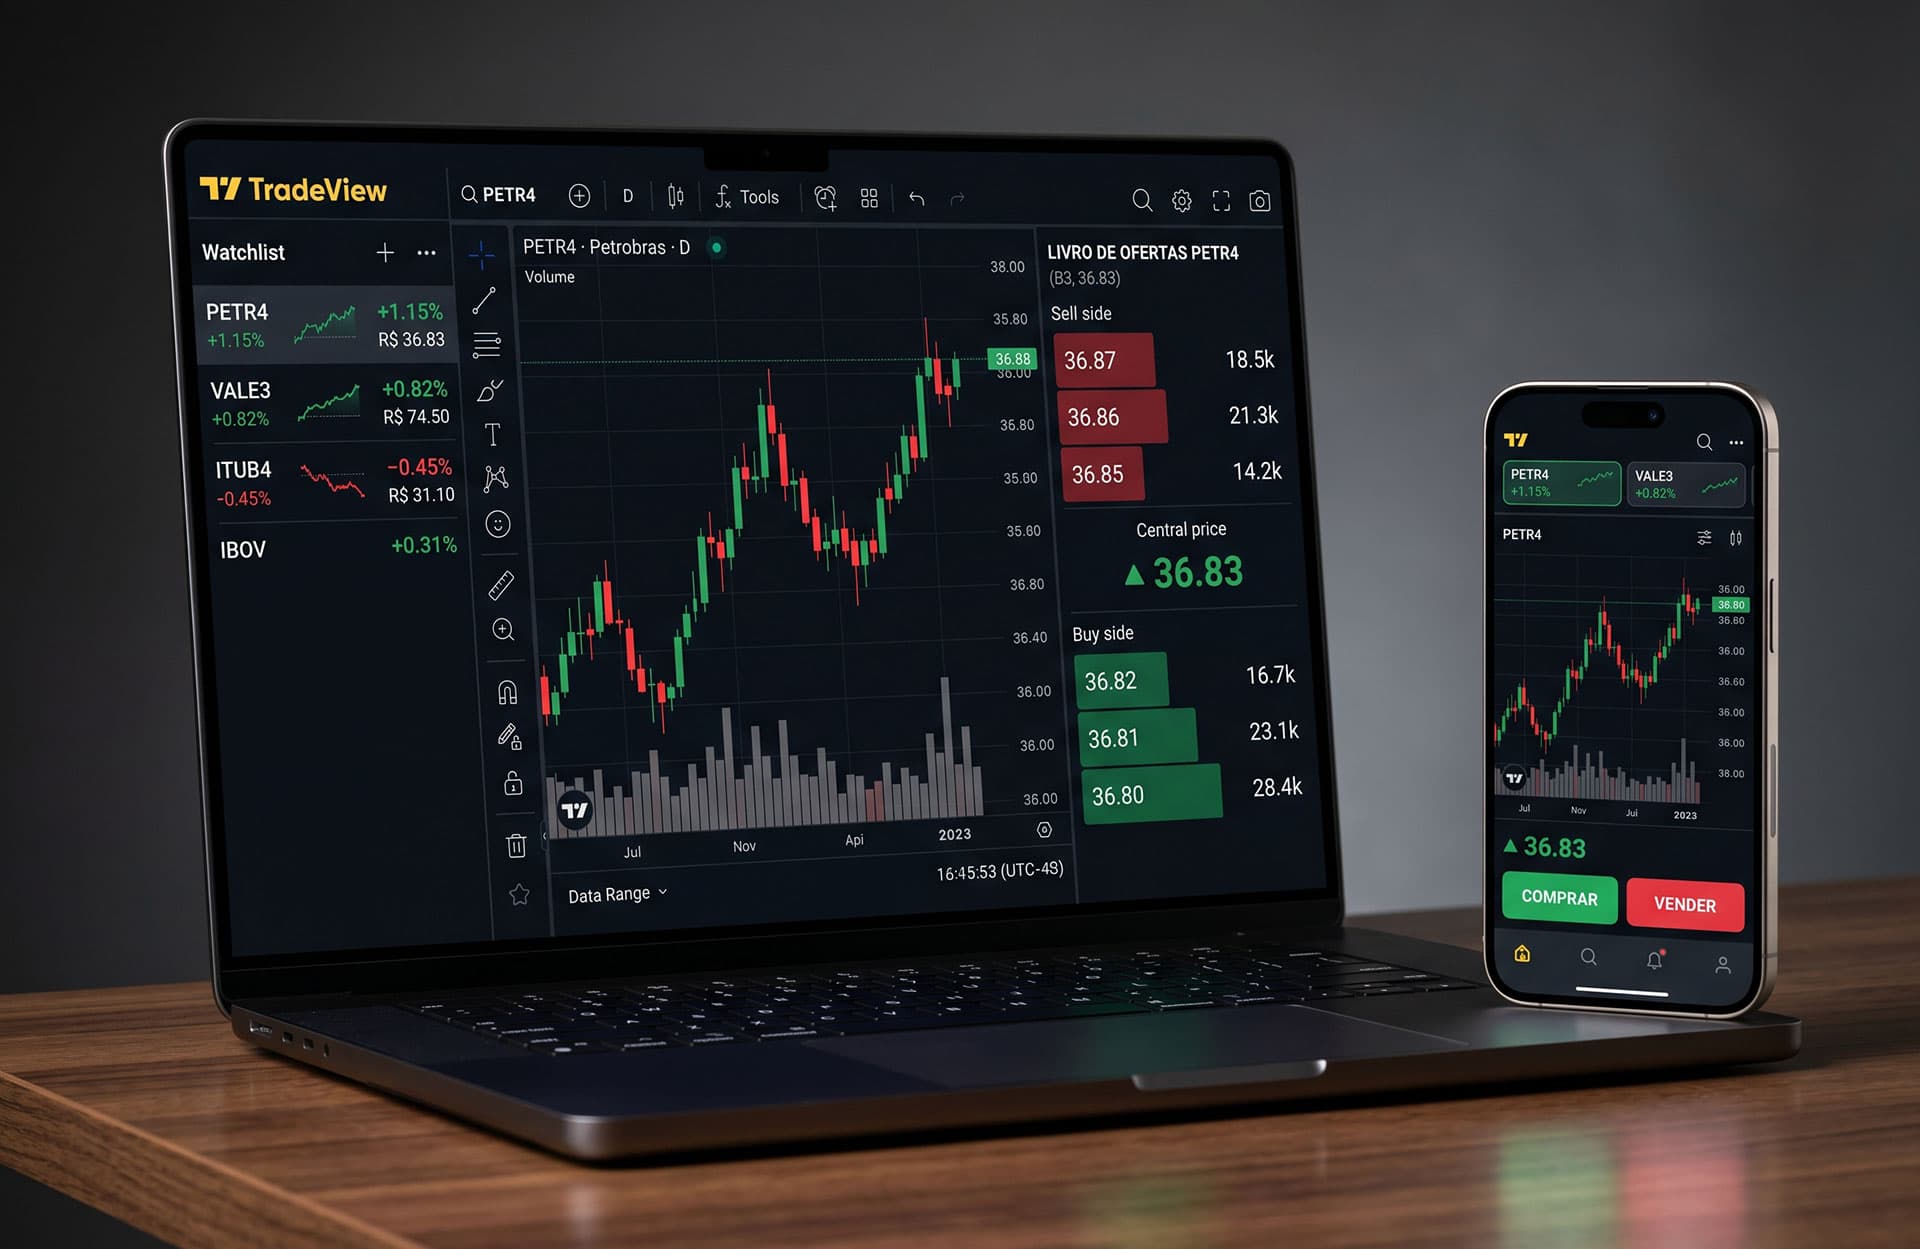
Simulated Brazilian stock trading platform built with Next.js and Lightweight Charts (TradingView). Includes live order book, candlestick chart, depth chart, watchlist, order panel, portfolio management, price alerts and trade history — with simulated data and interactive onboarding.
The challenge here is not to make it pretty, it is to tame density. Lots of data changing every second for a user who needs to decide fast and, above all, trust what they see. Every decision of hierarchy, color and motion carries weight: a misplaced number becomes a costly mistake.
The goal was to build a functional product from scratch, from login to chart, to prove practical mastery over complex data visualization components in the React ecosystem.
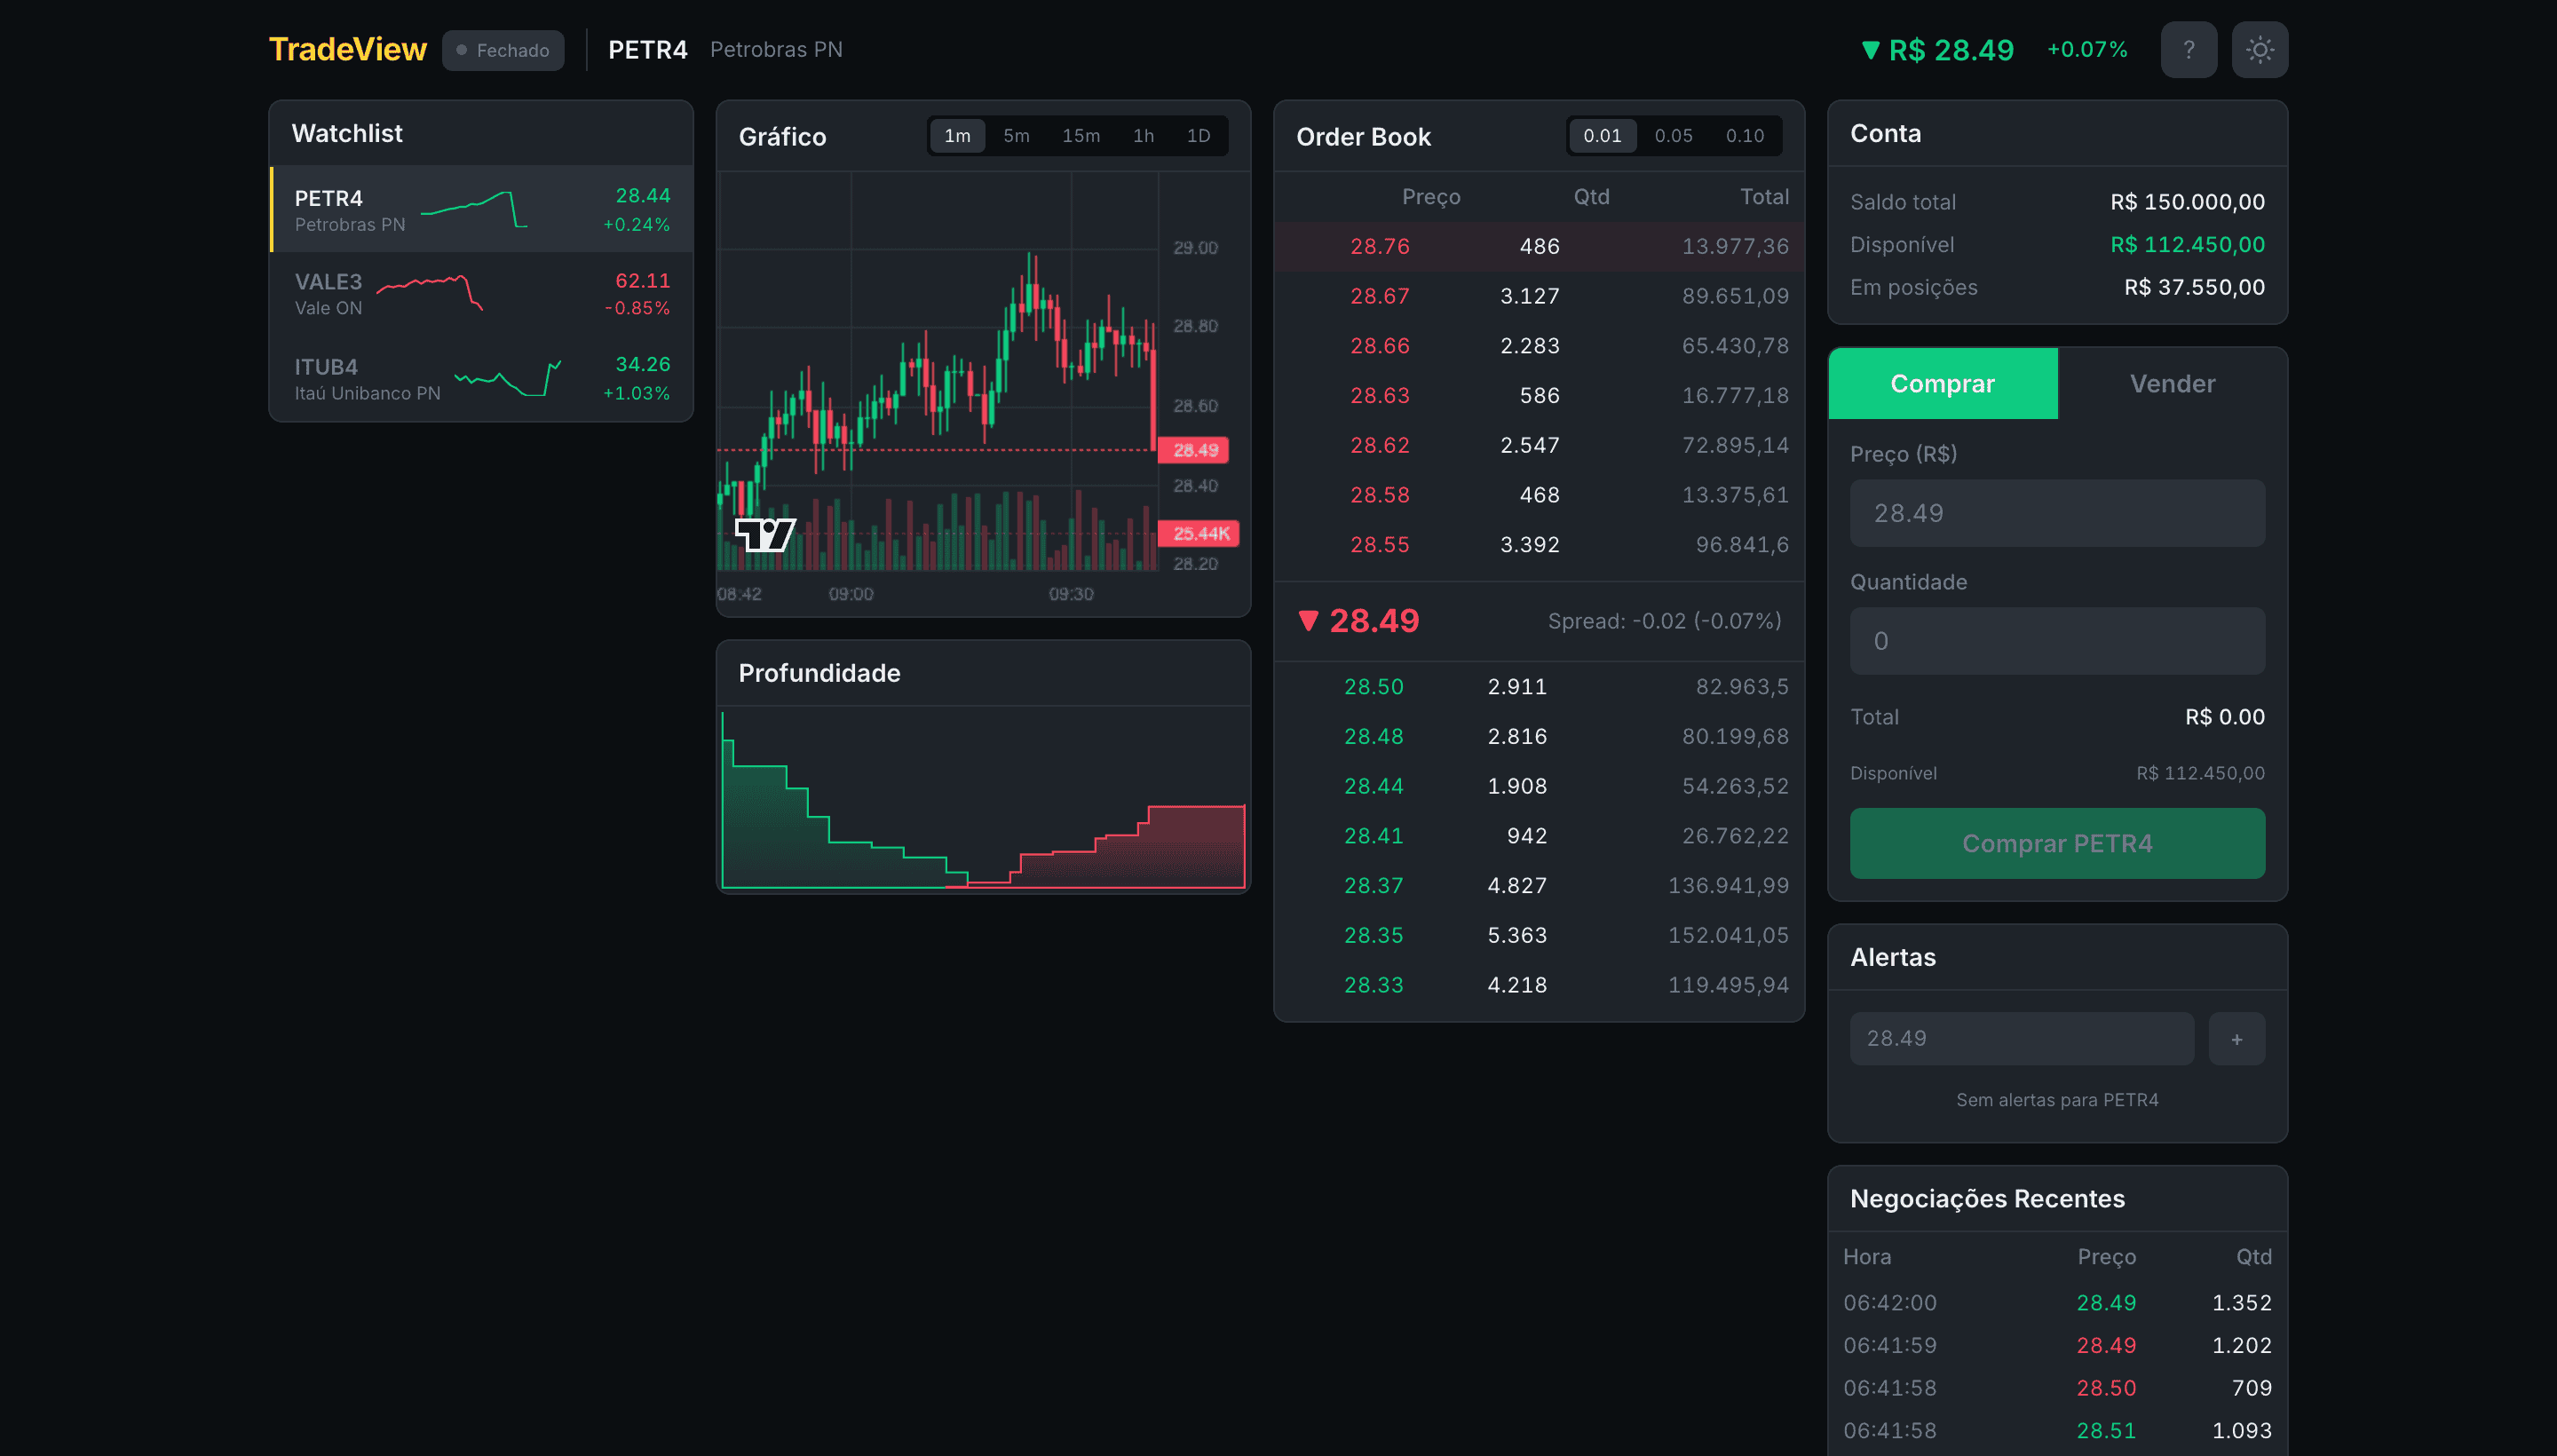
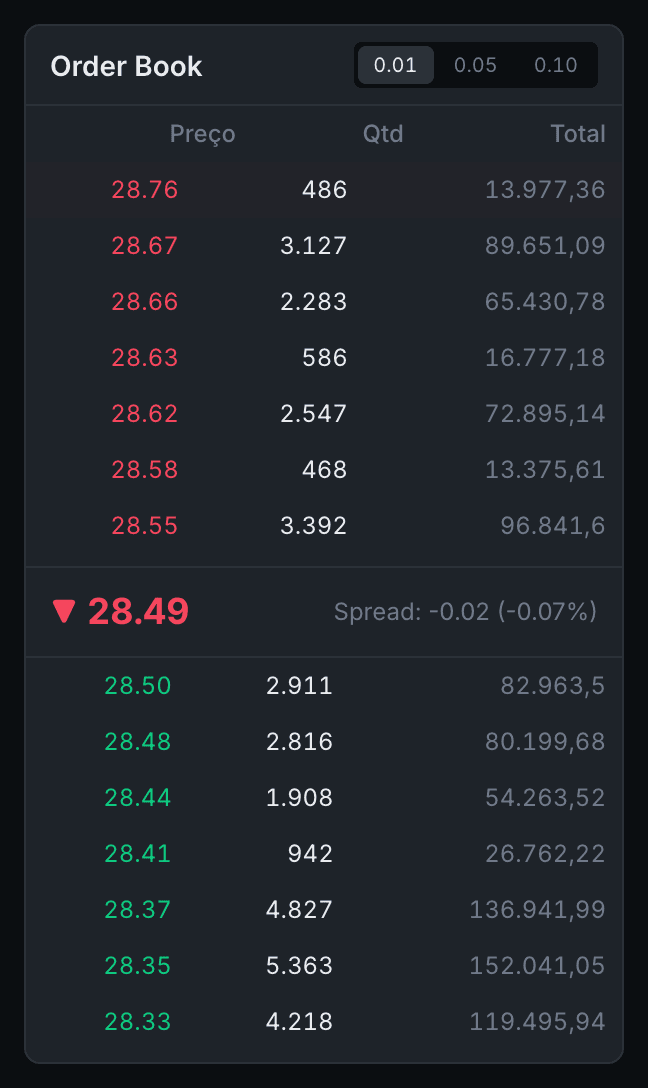
The technical core is the integration with Lightweight Charts, TradingViews financial charting library. The candlestick consumes simulated OHLCV data in real time and the depth chart renders accumulated market depth. The order book simulator generates order flow with dynamic spread and keeps every component in sync.

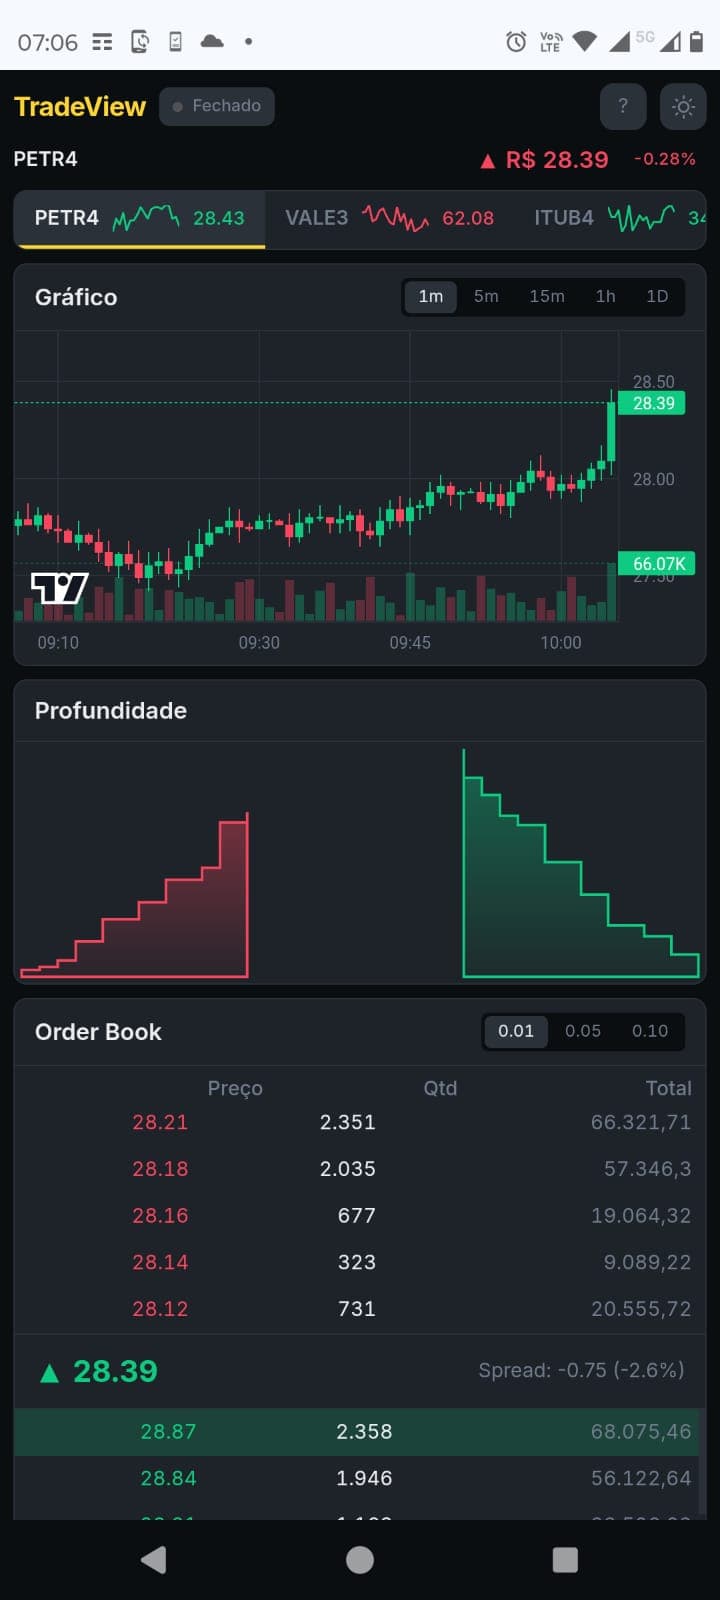
The same product adapted to the phone: the dense layout becomes a vertical stack, keeping chart, order book, account, buy/sell panel and portfolio reachable with the thumb.
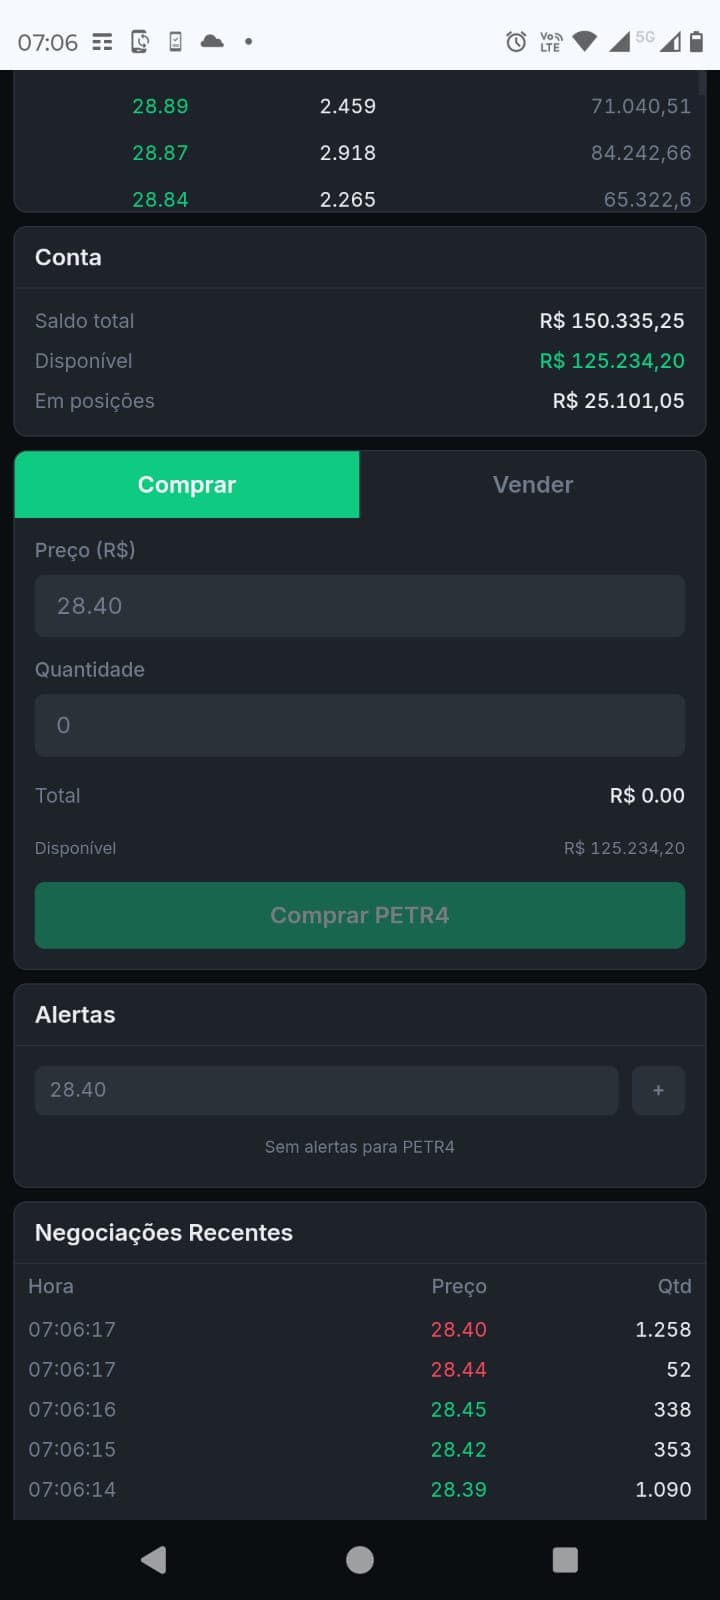
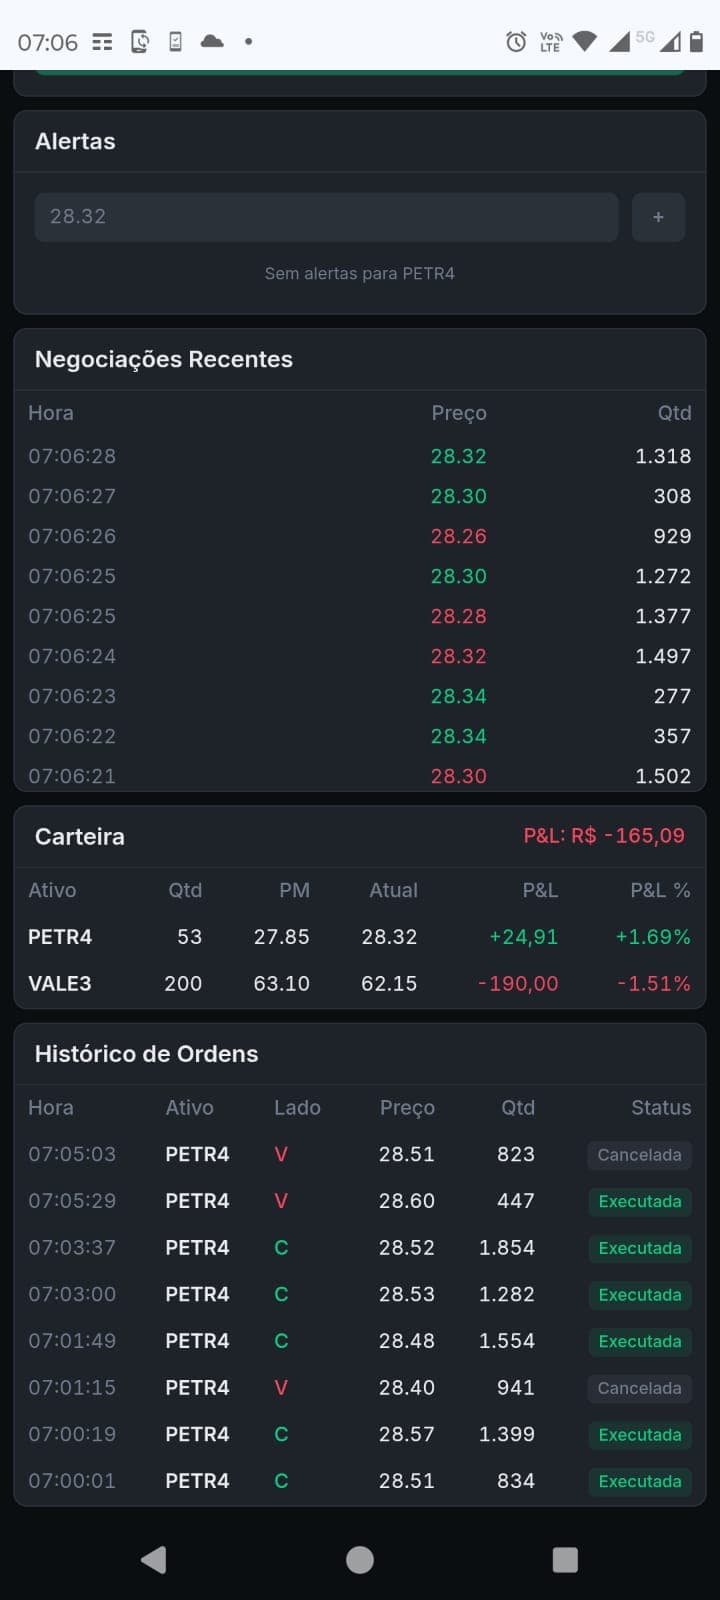
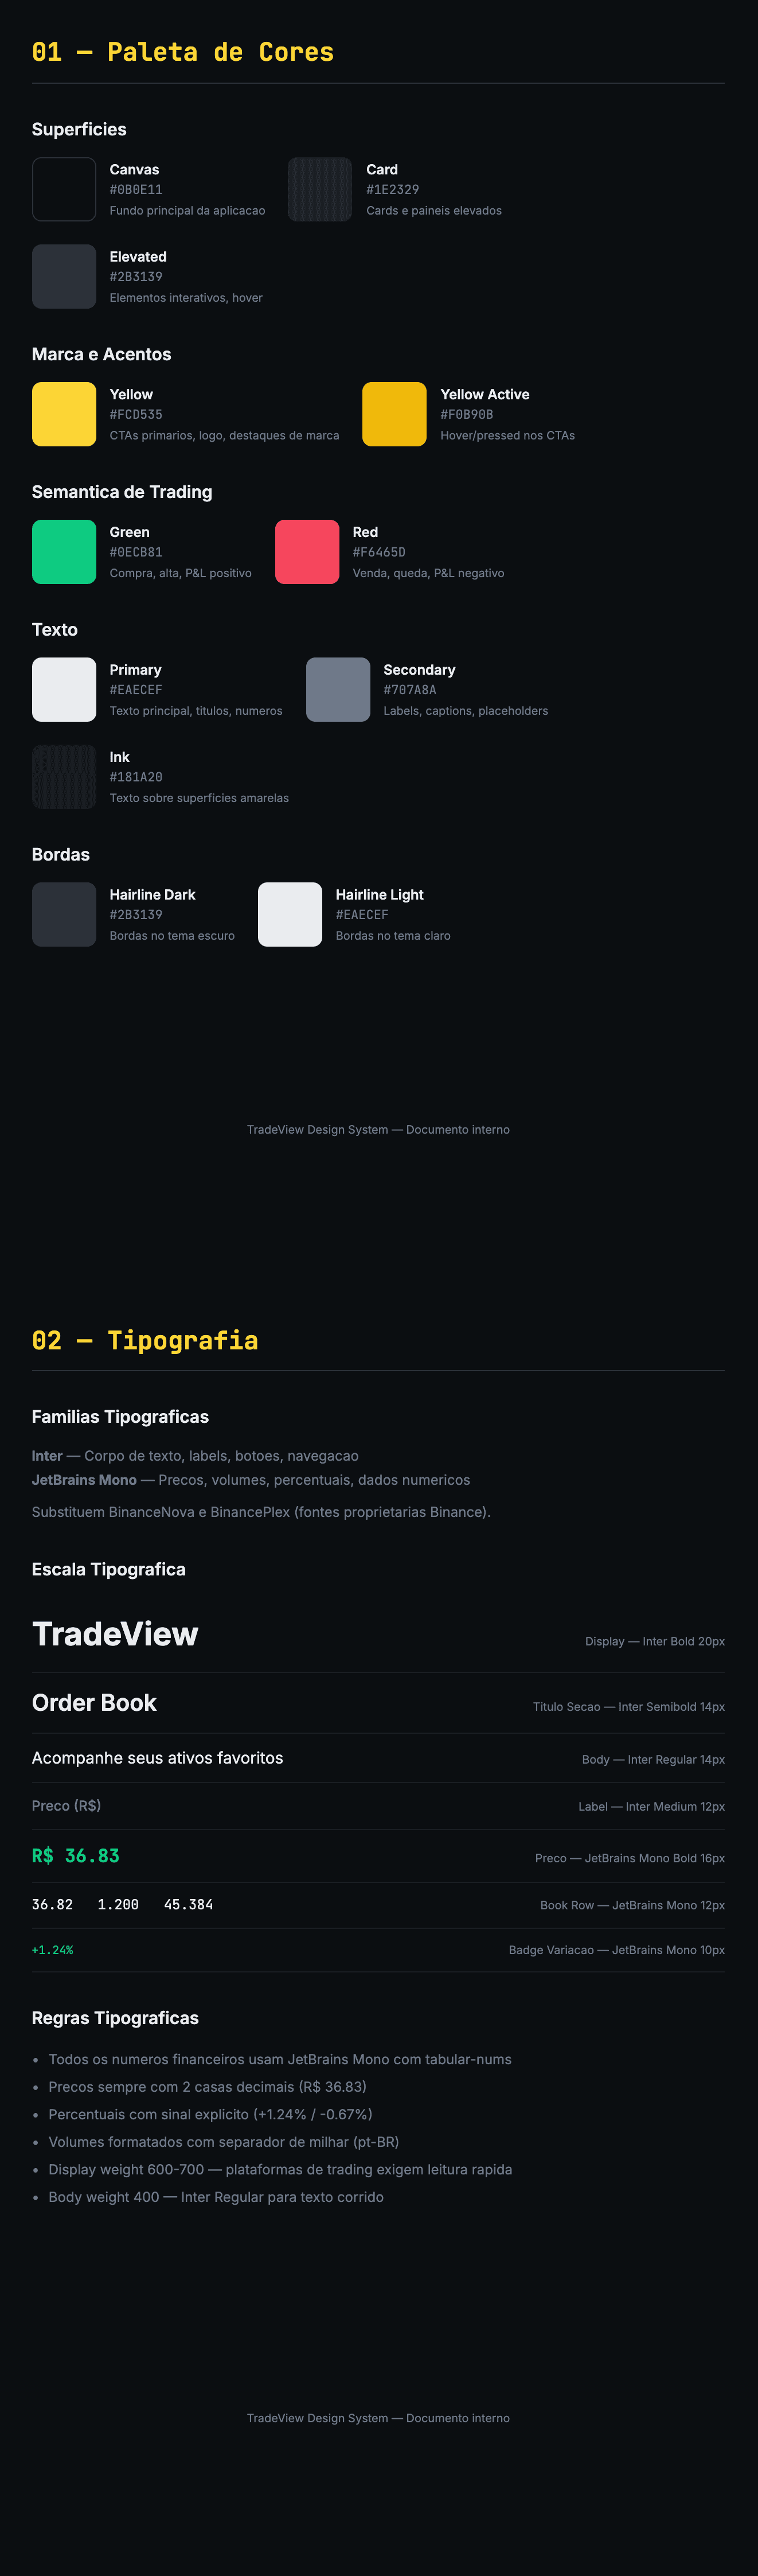
TradeView is dark-first by nature: the dark background reduces fatigue in long sessions and makes the data pop. Color carries meaning and is never decorative, green for up and red for down. Typography mixes a neutral sans for the interface with tabular, monospaced numbers for prices and volumes, ensuring alignment and fast reading.
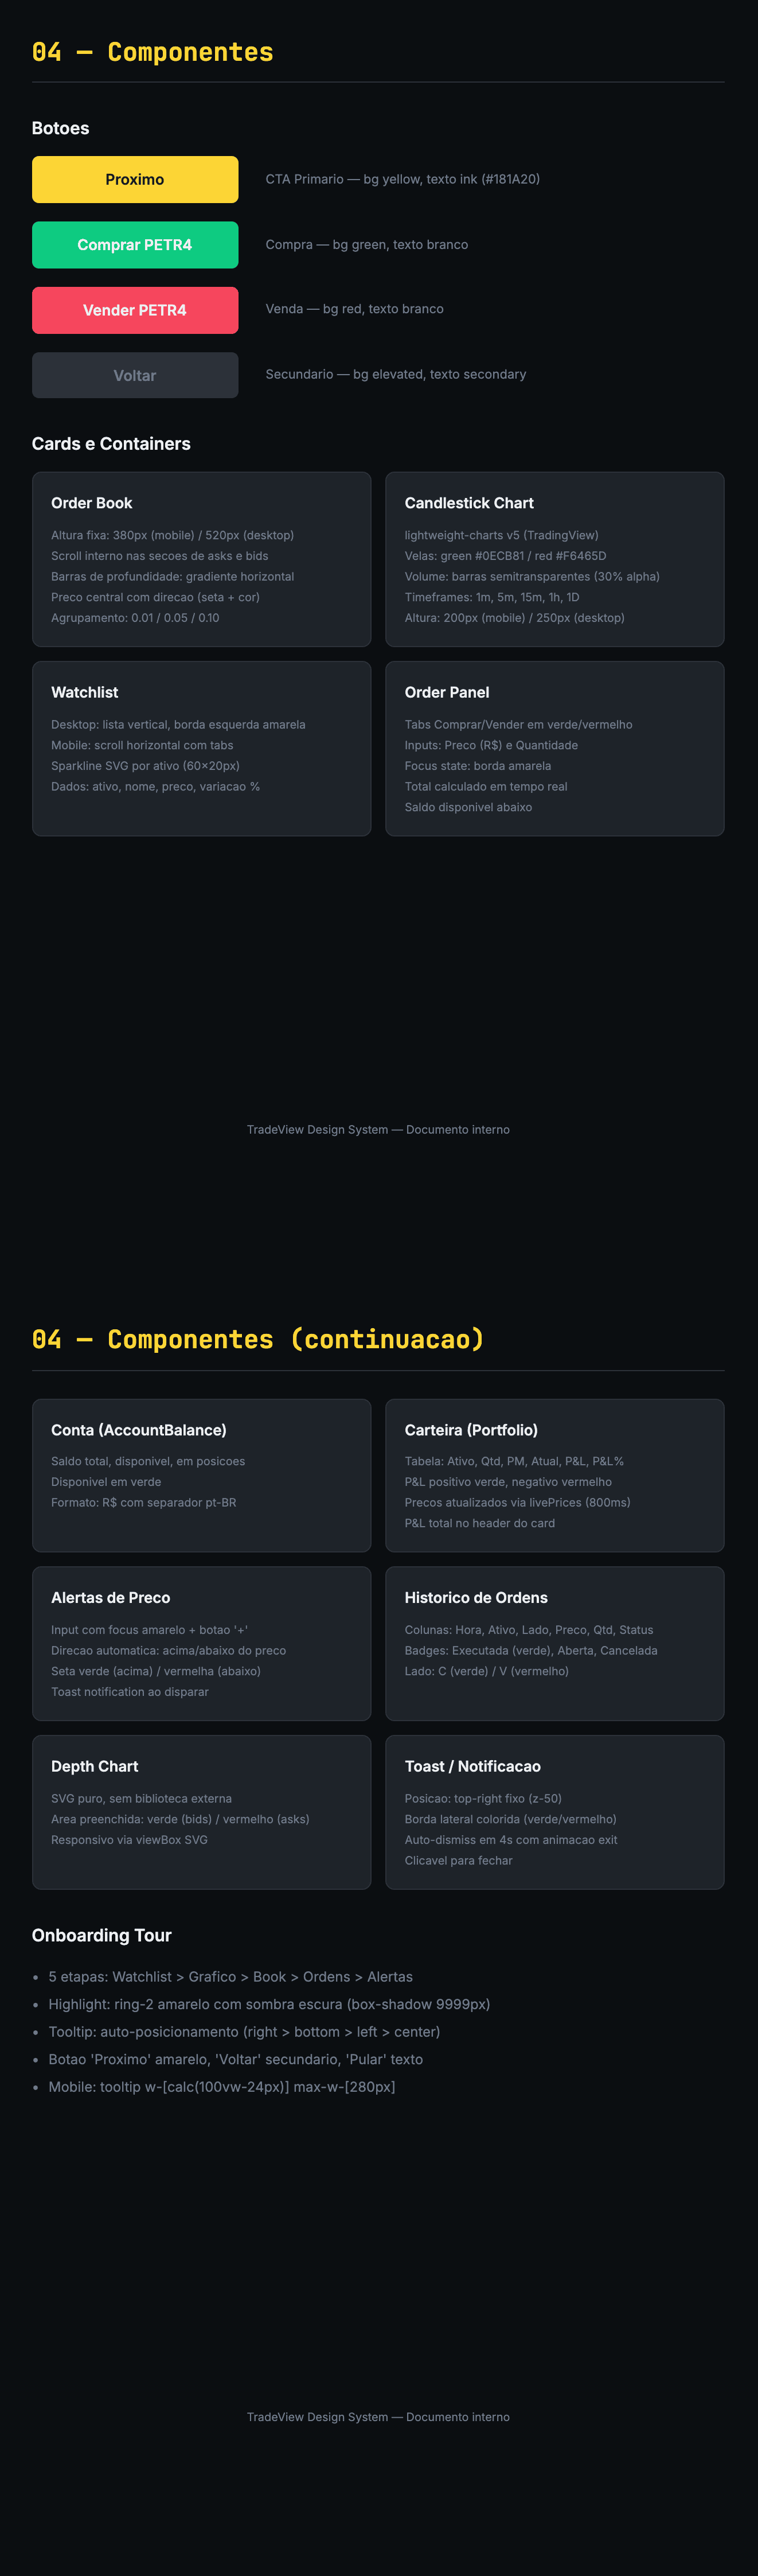
More than screens, TradeView shows the ability to take a dense experience from concept to a live product: interface design, component architecture and data visualization library integration, all built by me.